In our previous post, we explored logistic regression and saw how it can be used for binary classification tasks. Today, I wanted to write a little bit more about investigating the coefficients of the logistic regression model and learn about Wald's test, a statistical method that helps us determine if a feature is significant for our model. This was actually fairly new to me - up until now I had only really focused on the accuracy of the model as the main indicator of whether a certain feature affected the model (this is not to say it's not a useful metric, but there's more to it than that)!
Recall that in logistic regression, we have a linear combination of the predictor variables and their coefficients:
The coefficients represent the change in the log-odds of the outcome for a one-unit change in the corresponding predictor variable, holding all other variables constant. A positive coefficient indicates that an increase in the predictor variable leads to an increase in the probability of the outcome, while a negative coefficient suggests the opposite.
For example, in our previous post, we built a logistic regression model to predict whether a user will purchase an SUV based on their age and estimated salary. Let's suppose we want to now also include the 'Gender' column as a feature - well we would need to interpret the coefficients of the model to understand if it has any impact.
import statsmodels.api as sm

# ... Code to load and preprocess the data (make sure to one-hot encode gender)

# Create a DataFrame with the feature names
X_train_with_gender_df = pd.DataFrame(X_train_with_gender_sm, columns=["const"] + feature_names)

# Train a logistic regression model with the "Gender" feature using statsmodels
model_with_gender_sm = sm.Logit(y_train, X_train_with_gender_df)
results_with_gender_sm = model_with_gender_sm.fit()
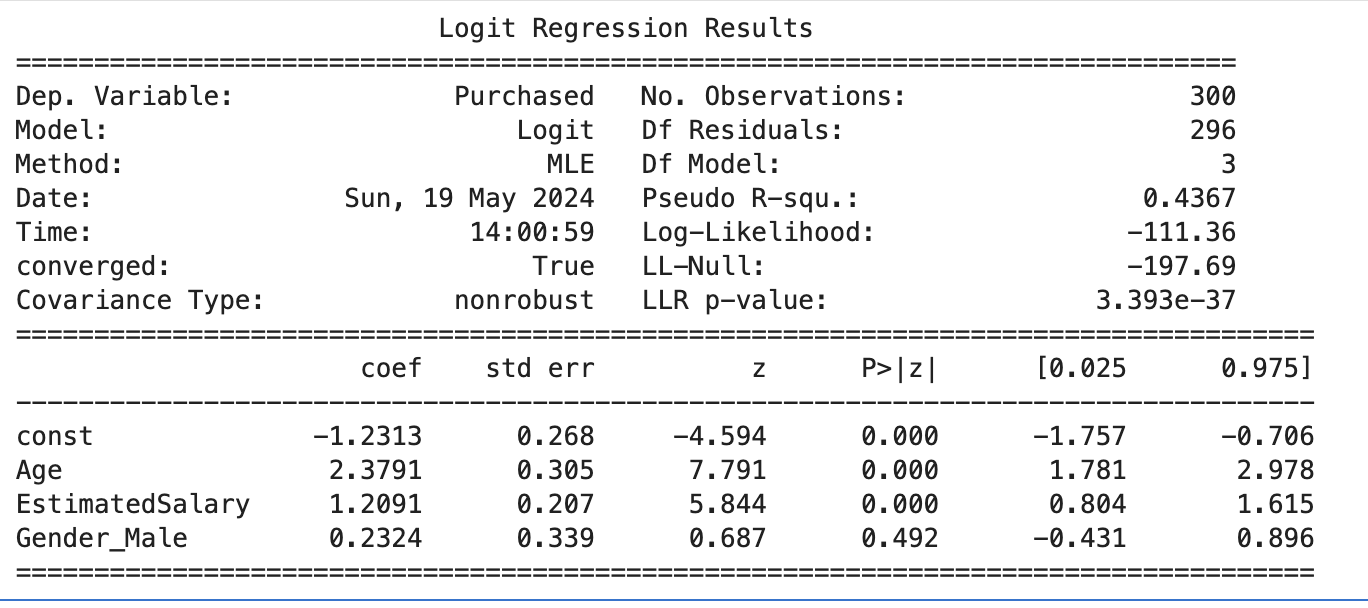
From the model summary (see image below), we can see the coefficients for each feature:
The term "log-odds" refers to the logarithm of the odds of an event occurring. The odds of an event are defined as the ratio of the probability that the event occurs to the probability that it does not occur.
For example, if the probability of purchasing is 0.8, the odds are 0.8 / (1 - 0.8) = 4. The log-odds are then the natural logarithm of 4, which is approximately 1.386. In simpler terms, log-odds transform probabilities, which are constrained to be between 0 and 1, into values that range from negative to positive infinity. This makes it easier to model and interpret the relationship between predictors and the likelihood of purchasing.
The coefficients for Age, EstimatedSalary, and Gender_Male tell us how much the log-odds of purchasing change with a one-unit increase in each predictor, holding the others constant.
While the coefficients give us an idea of the impact of each feature on the outcome, we need a way to assess the statistical significance of these coefficients. This is where Wald's test comes in. Wald's test is a statistical test used to determine if a particular predictor variable (feature) is significant in the model. It tests the null hypothesis that the coefficient of a predictor variable is zero, meaning that the variable has no effect on the outcome.
The Wald statistic for a coefficient is calculated as:
where is the standard error of the coefficient. Under the null hypothesis, the Wald statistic follows a standard normal distribution. If the absolute value of the Wald statistic is large (typically greater than 1.96 for a 95% confidence level), we reject the null hypothesis and conclude that the predictor variable is significant in the model.
Let's apply Wald's test to our logistic regression model to determine if the "Gender" feature is significant. We can use the z-value and p-value provided in the model summary. The z-value for the "Gender_Male" coefficient is 0.687 and the corresponding p-value is 0.492.
A z value of 0.687 is less than 1.96, and the p-value of 0.492 is greater than 0.05 (the standard thresholds used to understand the significance of a co-efficient). Therefore, we can say that the "Gender" feature is not significant in predicting the likelihood of purchasing an SUV in this model.
Based on the results of Wald's test, we can make decisions about which features to include in our logistic regression model. If a feature has a high p-value (above the chosen significance level), it indicates that the feature may not be contributing significantly to the model's predictive power.
In our case, the "Gender" feature appears to be not significant, so we might consider removing it from the model to simplify the model and focus on the more influential features like "Age" and "EstimatedSalary". However, it's important to note that the significance of a feature can depend on the specific context and problem at hand. Domain knowledge and practical considerations should also be taken into account when deciding which features to include or exclude.
In this blog post, we explored the importance of coefficients in logistic regression and learned about Wald's test, a statistical method for assessing the significance of individual features. By interpreting the coefficients and applying Wald's test, we can gain insights into which features are most influential in our model and make informed decisions about feature selection. Understanding coefficients and Wald's test is crucial for building effective logistic regression models and improving their interpretability. By focusing on the significant features, we can create more parsimonious models that are easier to understand and potentially more robust.
I'd also like to mention that this post was inspired by the amazing content on the StatQuest YouTube channel by Josh Starmer. Please check out his videos on logistic regression for a more in-depth explanation of these concepts!